

On Saturday, 18 April 2026, the 1926 Census of Ireland was released to the public for the first time. The National Archives made the records freely searchable exactly 100 years after census night, opening the first census taken after the establishment of the Irish Free State.
That release made the collection accessible at national scale, but not especially legible at local scale. You can find a person or household quickly; it is much harder to browse one community as a place.
Ardmore 1926 is my answer to that gap: a local-history GIS site for the Ardmore and Grange area of County Waterford. It reorganises the census around 46 townlands, 277 households, and 1,146 people so users can move between map, household index, townland profiles, names view, and summary statistics without leaving the place they are trying to understand.
Problem
The public census search is powerful for family history. Search for a person, open the scanned return, and you can see where one household was on census night.
Local history needs a wider frame. A single return tells one family story; a place-first dataset shows how a village and its surrounding townlands fitted together. Household structure, language patterns, surnames, migrant origins, and geography all come into view at that scale.
The data was there. The harder part was turning a national archive into something locally explorable without pretending the underlying record was cleaner or more certain than it really is.
What I Built
Ardmore 1926 is a static local-history GIS site built around the Ardmore and Grange area rather than around a person-name search box.
The site gives users several ways into the same local dataset:
- a townland overview with quick facts and placename context
- a household browser with search and filters
- townland pages with local demographic summaries
- a names view for surnames, first names, and migrant origins
- a statistics dashboard for cross-area comparisons
- an interactive map for exploring townland patterns spatially
The public National Archives search remains the source of truth. Ardmore 1926 adds a local interpretation layer that makes a place easier to browse, compare, and explain.
What Users Can Explore
The overview page starts with townlands because that is the scale at which many local-history questions become legible. Each card gives a summary and, where available, the Irish placename and meaning from Logainm. From there, users can open a townland page to see its households, age profile, Irish-language figures, and basic demographic breakdown.
For direct record browsing, the household page is the main route in. You can search by name, filter by townland, or narrow the list by household type. Each household expands to show members, relationships, ages, language records, birthplaces, and links back to the scanned National Archives return.
The statistics page pulls the area together with charts and tables covering age structure, Irish-language share by townland, household sizes, household types, surnames, religion, and other summary views. The names page supports a more human kind of pattern spotting by surfacing common male first names, female first names, surnames, and migrant origins.
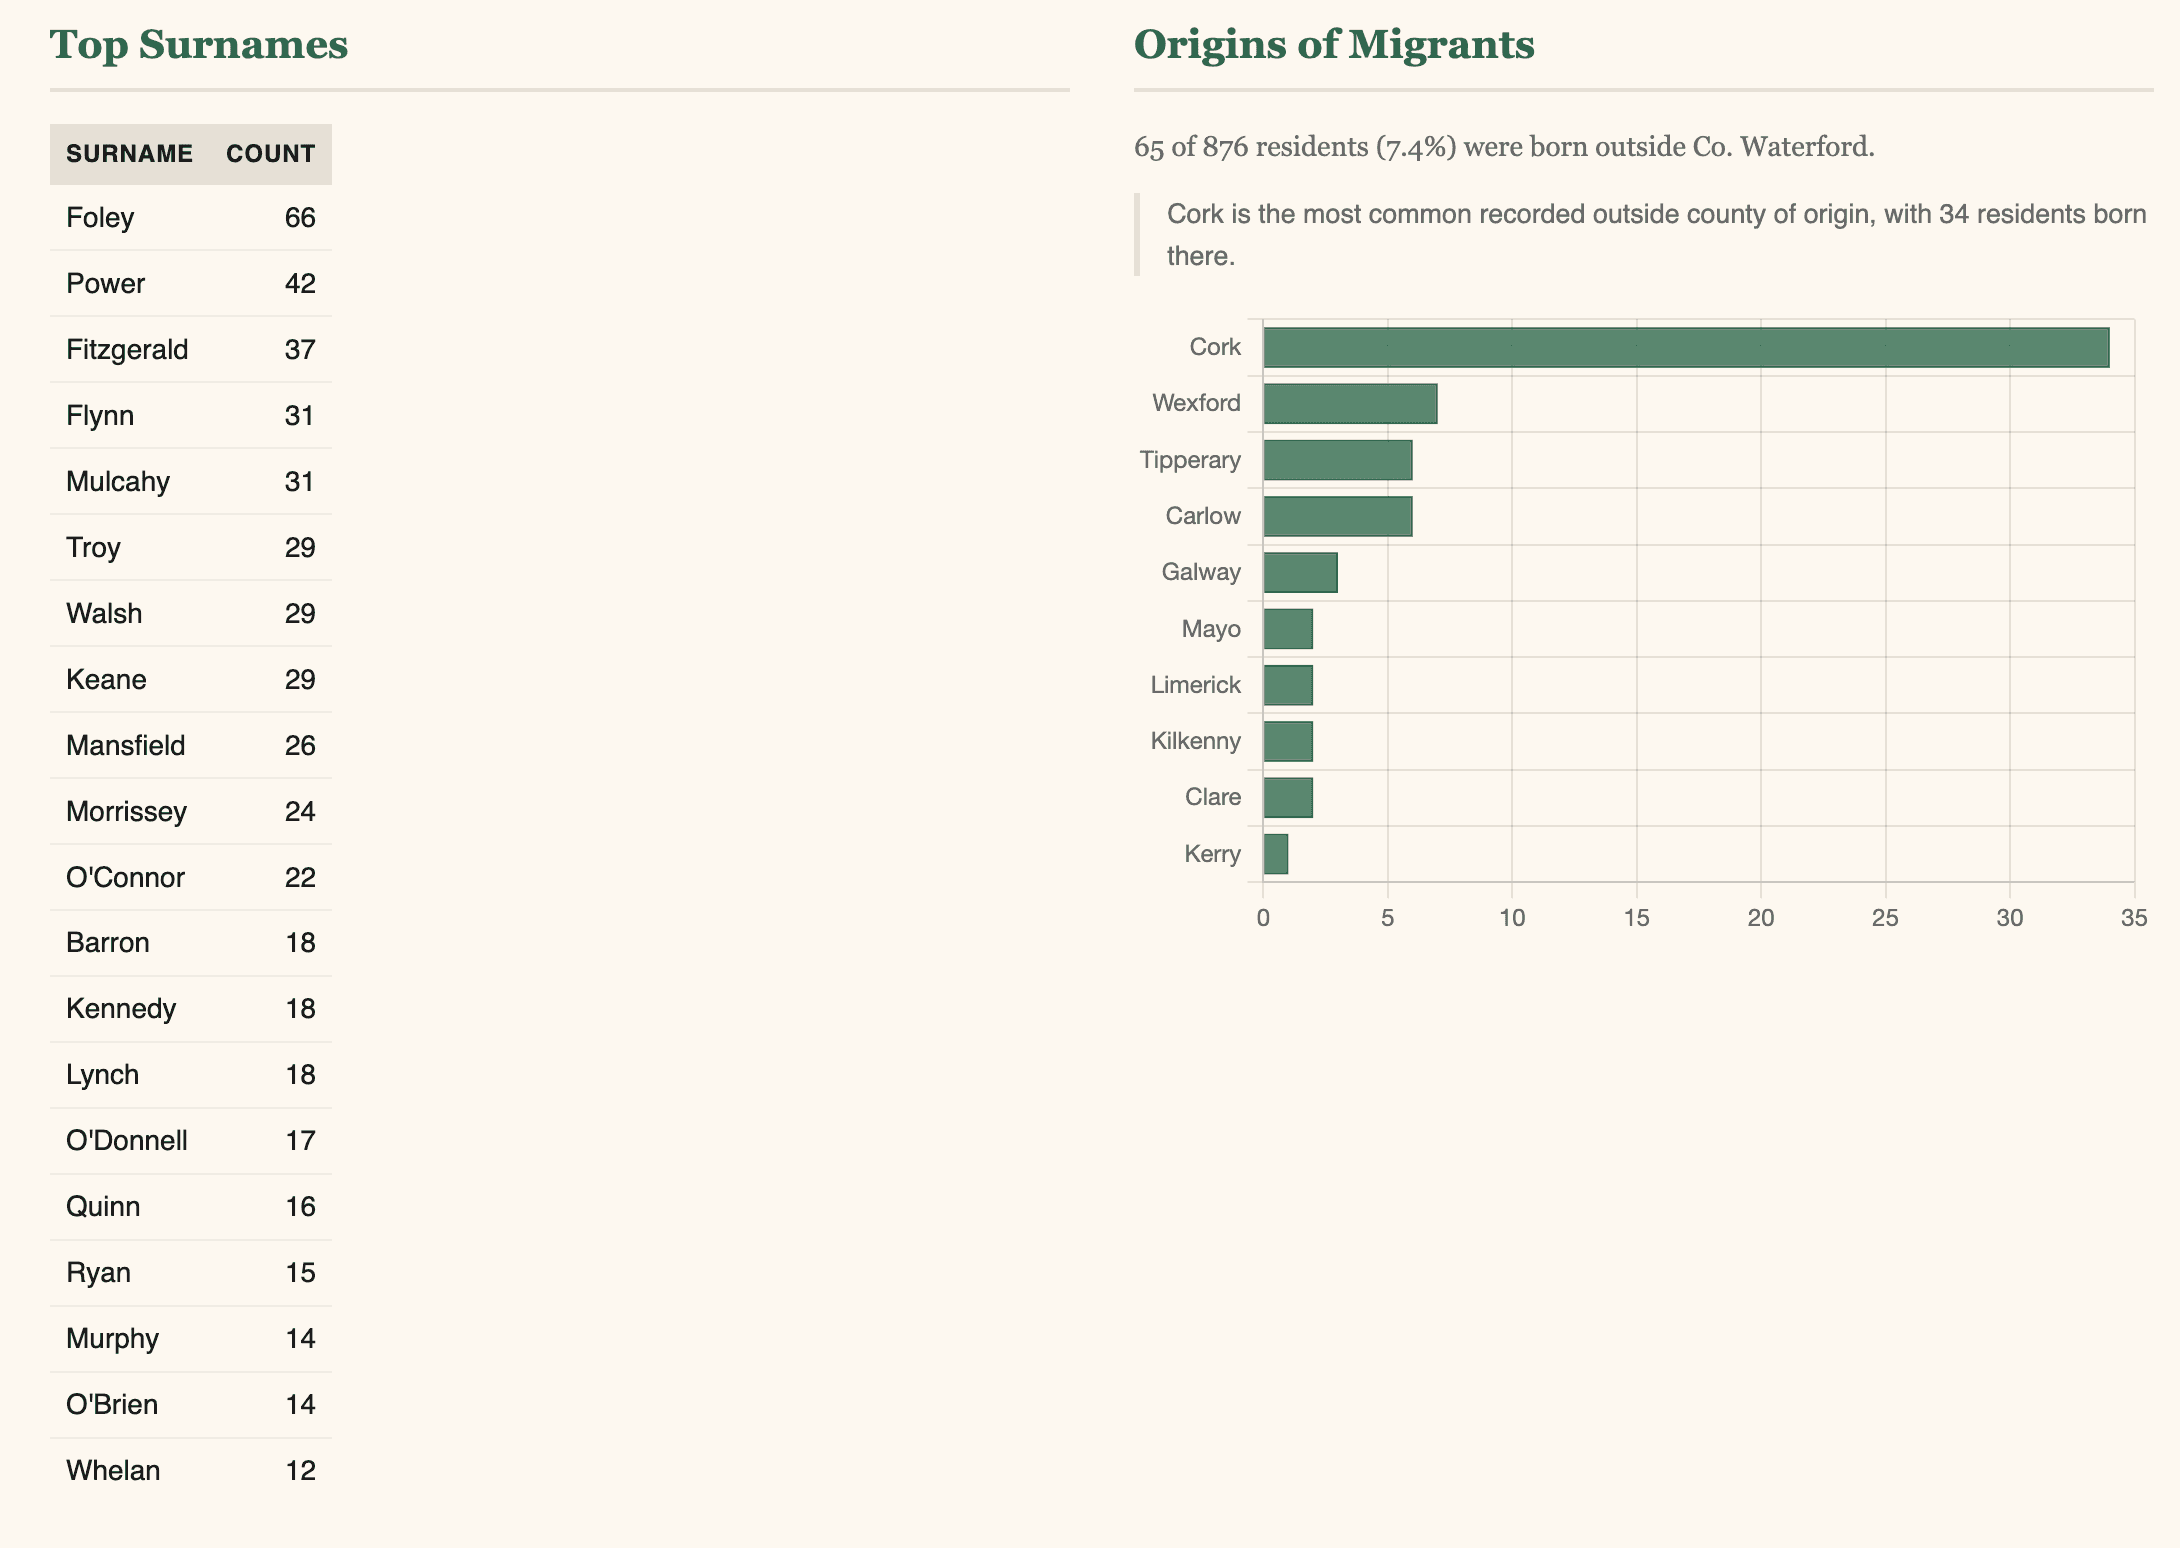 Figure 1: Surname frequencies and recorded migrant origins from the Ardmore 1926 names page.
The GIS centre of the site is the map. It shows the 46 census townlands as polygons, with surrounding townlands added as a quieter context layer so the Ardmore area does not float in empty space. The default layer maps the share of people recorded as speaking Irish, with options for population density, mean age, local-born share, and average household size.
If you want a simpler demographic mapping example at a larger geography, Mapping Dublin's Population Change with R shows an earlier choropleth workflow using census data and electoral districts.
Dataset and Cleaning Decisions
The published Ardmore site has no live census-processing step. Everything has already been cleaned, filtered, grouped, and exported into static files before deployment.
The current export contains:
- 1,146 people
- 277 households
- 46 census townlands
- 46 mapped census townland polygons
- 107 adjacent townland polygons for map context
Static files keep the site fast and simple. The browser fetches prebuilt JSON and GeoJSON, then renders pages, charts, filters, and the map. Runtime infrastructure stays minimal: no backend API, database server, or live data processing.
The processing work happened earlier in a separate census workflow. I started from a Waterford county extract from the National Archives API, cleaned it, filtered it to the Ardmore area, and exported the site data.
That source data still needed careful review, even where the National Archives supplied updated_* fields. Those fields were extremely useful, but they were not automatically analysis-ready.
Relationship-to-head values are a good example. Some were straightforward: head, wife, son, daughter, servant, boarder. Others included spelling variation, Irish-language terms, OCR noise, and values too damaged to classify safely. For the public site, I grouped relationships into broad categories such as Head, Spouse, Child, Grandchild, Servant, Boarder, Visitor, Other family, and Unclassifiable. That supports browsing and summary analysis without claiming more certainty than the evidence allows.
Birthplace needed the same restraint. Many Waterford variants could be normalised confidently, but not every fragment or OCR-damaged value could be repaired. Where the evidence was weak, the value stayed unknown.
Some fields were deliberately left out of the main site. The fertility and child-survival fields had enough corruption in the wider Waterford extract that a public local dashboard would need narrower review before using them responsibly.
Household structure also needed intervention. The census used form names as household identifiers, but some larger households continued onto addendum pages. Those could appear as separate headless households unless they were linked back to the parent form. The cleaning script merged addendum pages into parent households where the file naming pattern and image group made that defensible.
I wanted the public version to stay honest about the record and remain traceable back to the original source.
Boundary and Mapping Decisions
One of the trickiest GIS questions was the boundary itself.
Census administration in 1926 relied on formal geographies such as District Electoral Divisions. Local identity follows looser boundaries. A parish, village, hinterland, DED, and townland set can overlap without matching exactly.
For this site, Ardmore is defined as a local-history area rather than as a single official census unit. It includes the core Ardmore, Grange, and Glenwilliam area, with a small number of neighbouring townlands added where they clearly belong to the Ardmore hinterland. Some townlands from otherwise included administrative units are excluded where they sit farther from the local area being represented.
That makes the boundary an editorial and historical choice. There was no single official Ardmore census unit in 1926, and that matters because every map and every denominator depends on where the line is drawn.
OpenStreetMap townland geometry provided the map boundaries, with manually verified relation IDs used for matching. Townland names repeat, spellings vary, and names such as Newtown or Ballyquin can easily point to the wrong place if they are matched automatically. For Ardmore, I used verified OpenStreetMap relation IDs for the census townlands, then attached census counts and summary statistics to each polygon.
Surrounding townlands use a separate context layer so the study area makes spatial sense without being confused with the dataset itself. Irish placenames came through a separate Logainm workflow. The site uses Logainm names and glossary meanings where they could be matched confidently, with manual overrides where census spellings, OpenStreetMap names, and Logainm records did not line up neatly.
Here, GIS means more than drawing shapes. The map depends on placename reconciliation, local boundary decisions, data cleaning, and geometry checks agreeing with one another.
Technical Approach
The public site keeps the delivery architecture simple.
It is a Vite and TypeScript static app. Leaflet handles the map. Chart.js handles the charts. Each page fetches static files from public/data/: household records, summary statistics, townland polygons, and context polygons.
That architecture suits the project because the data changes only when the processing pipeline is rebuilt. A live application server would add complexity without adding much value. Static hosting keeps the site easy to serve, cheap to run, and quick to load.
Most of the hard work therefore happens before publication. Household classification, townland summaries, Irish-language percentages, birthplace normalisation, placename enrichment, and GeoJSON exports all need to be prepared ahead of time. The browser can then focus on browsing rather than rediscovering the dataset on every page load.
Outcome and Why It Matters
A national dataset carries its force locally. People want to find grandparents, farms, neighbouring households, family names, and familiar townlands. Ardmore 1926 turns that instinct into a place-first interface rather than leaving it at the level of one scanned return at a time.
For Ardmore, the census captures a coastal community in the early years of the Irish Free State. It shows who was living in the village, who was spread across the surrounding townlands, which households were extended, who was born locally, and where Irish was recorded in everyday use.
Putting that on a map changes the experience. You can start from an individual record and move outward into the community, or start from the townland and work inward toward people and households. The census becomes something you can browse locally, not just search nationally.
Beyond Ardmore
Ardmore is the first public expression of a larger workflow. Since building it, I have been extending the same ideas across the full 26-county 1926 Census dataset in a separate project called census-26. That wider work now includes county-level raw downloads, a SQLite analytic mart, QA reports, cleaning rules, birthplace and migration readiness checks, Logainm-based geography reconciliation, and household-quality review.
The national workflow is more cautious than a public showcase needs to be. It keeps uncertainty visible through explicit eligibility fields, warning flags, review queues, and documented caveats. I want future local-history projects to follow that path: reproducible local datasets with clear denominators, visible uncertainty, useful maps, and links back to the source material.
If you want to see the same place-first instinct applied to a live operational dataset instead of a historical one, Building a Real-Time Flood Monitoring Dashboard for Midleton shows how the approach changes when the data is real-time, fragmented, and outage-prone rather than archival.